Tuesday, November 25, 2008

Thanksgiving naps - is it the tryptophan?

We most likely all know someone who, after a large Thanksgiving meal, will move to the couch and take a nap, possibly blaming the high level of tryptophan in turkey for making them so tired. So what is tryptophan, is there a high amount in turkey, and does it really make us sleepy?


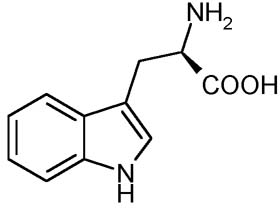
Tryptophan (see figure at left) is one of the 20 naturally occurring amino acids that make up the proteins in our body. Since humans are unable to synthesize tryptophan from basic building blocks, we must consume it in our diet. There are ten essential amino acids that we must consume in adequate amounts: Arginine (only for young), histidine, isoleucine, leucine, lysine, methionine, phenylalanine, threonine, tryptophan, and valine.

So where does the link between tryptophan and sleep come from? Tryptophan is a precursor in the synthesis of two important signaling molecules, serotonin and melatonin (see pathway at right). Serotonin is a neurotransmitter that has multiple effects in both the central and peripheral nervous system. In the CNS, it has been shown to regulate sleep and mood. The effects of the hormone melatonin are opposite those of serotonin: What one inhibits, the other will activate.

So is there enough tryptophan in turkey to account for the sleepiness we feel after Thanksgiving dinner? According to this chart, turkey falls somewhere in the middle range as far as grams of tryptophan per 100 grams of food, with 0.24 g tryptophan per 100 grams of turkey. Compare this with egg whites, which have 1.00 g tryptophan per 100 g (dry), or Parmesan cheese, which has 0.56 g tryptophan per 100 g. Additionally, tryptophan is converted to melatonin in the intestine, where it functions to regulate digestion (peristalsis). Very little of this intestinal melatonin will enter the blood stream to get to the brain and make us feel sleepy, although there is evidence that if there is an excess in the intestine, some melatonin will leak into the blood stream. There is also a link between extra tryptophan in the diet and melatonin in the bloodstream. This increase in melatonin level has been shown to cause a phase shift the body's circadian rhythm, the normal cycle of resfulness and alertness that is common in all living things. This phase shift may make our bodies think it is later than it actually is, which contributes to a feeling of sleepieness. Interestingly, this phase shift may also contribute to feelings of wakefulness later in the night.

However, these studies were done in rats and chickens with pure tryptophan introduced directly to the stomach. The problem with this is that you do not eat a big plate full of tryptophan on Thanksgiving, or even a big plate of only turkey. You eat a big plate of turkey, stuffing, mashed potatoes, gravy, dinner rolls, pumpkin pie, etc. Adding all these extra nutrients will affect the absorption of melatonin into the bloodstream. Another problem is that tryptophan works best to stimulate sleep on empty stomach - something that is very rare after Thanksgiving dinner.

So what causes the sleepies? There are a few other suspects associated with Thanksgiving dinner. Carbohydrates, such as the starch found in potatoes, stuffing and bread may indirectly lead to an increase in tryptophan in the blood. Fats tend to slow down digestion of all parts of the meal, which makes digestion take longer and lead to longer periods of fullness. If there is alcohol served at dinner, it will function as a general depressant of the central nervous system.

In my opinion, the most likely culprit is simply the size of the meal. The typical Thanksgiving dinner contains more than 4000 calories. The USDA recommends about 2500 calories per day, so some people are basically eating two days worth of food in one sitting. When you are digesting, the body diverts blood flow away from the extremities and brain to the digestive system. This is why it often feels colder outside after eating - less blood in the extremities to keep them warm. Less blood to the brain means less oxygen, which may make you feel tired. There are a few calorie calculators out there for you to try to regulate your food intake. They are not perfect, but they will give you a rough idea of how much you are eating.

So what should you do? I am going to eat a small breakfast, probably not much lunch and try to go light on the appetizers. Then I can eat as much at dinner as I want to, and not worry about it. Thanksgiving is only once a year, might as well celebrate. Its not like the football games are going to be any good.

Wednesday, November 19, 2008

Genetics problems review answers/explanation

Here are the answers and explanations for the genetics review problems from class today. There will be a few problems on the test. I will be online till around 10.45 or so tonight if you have any questions.

1. Colorblindness is a sex-linked, recessive trait. Remember that sex-linked traits are on the X chromosome, which means that men only have one copy of the gene. In this example, we are told that the man has colored vision, so his genotype must be XCY. The woman also has colored vision, so she could be XCXC or XCXc. Since one of her sons is colorblind, she must be XCXc, since sons inherit their X chromosome from their mothers.

2. This is a relatively simple dihybrid cross. If we use B for brown eyes and b for blue eyes; and H for brown hair and h for blonde hair, the genotype of the man is BbHH, and the woman is bbhh. Doing the cross, their children have a 50% chance of being BbHh and a 50% chance of being bbHh. Answering the question posed on the sheet, there is 0 chance their children will have blue eyes and blonde hair.

3. This is an example of a dihybrid cross where one of the genes displays incomplete dominance - red and white flowers give pink. We are crossing two F1 plants, so the phenotype of both parents is TtRr. For this type of dihybrid cross with complete dominance, we would normally expect the 9:3:3:1 ratio. However, with incomplete dominance there is a new phenotypic class, since the heterozygous individuals are distinct from the homozygous dominant individuals. The expected phenotypic ratios are then 3 tall, red-flowered; 6 tall, pink-flowered; 3 tall, white-flowered; 1 dwarf, red-flowered; 2 dwarf, pink-flowered; and 1 dwarf, white-flowered.

4. A dihybrid cross with a lethal allele. If an individual is homozygous recessive for the l allele, they will not survive, and are not counted in the phenotypic ratios for the answer. The parental genotypes are LlBb and Llbb. After throwing out the individuals with the lethal gene combination, the phenotypic ratio in the offspring is 1 normal-legged, brown; 1 normal-legged,white; 2 deformed-legged, brown; and 2 deformed-legged, white.

5. Gene linkage. You absolutely must know how to analyze these types of data, and tell the difference between parental and recombinant phenotypes. The data that are presented are from a testcross on the F1 generation. The genotypes for this cross are CcShsh crossed with ccshsh (remember, a test cross is always performed with a homozygous recessive individual). The phenotypes of the parents are colored, full seeds and colorless, shrunken seeds.

If we assume that these genes are going to follow the Mendelian laws of inheritance, we predict that the offspring would have equal numbers of the four possible phenotypic classes: colored, full; colored, shrunken; colorless, full; and colorless, shrunken. HOWEVER, that is NOT what the data show. Two of the phenotypic classes, colored, full seeds and colorless, shrunken seeds are MUCH more common than the other two. These two common phenotypes are called the PARENTAL phenotypes, since they resemble the parents of the cross. The other two phenotypes, which are much less common, are called RECOMBINANT phenotypes, since these gene combinations do not exist in the parental generation.

To calculate the map distance, we need to calculate the recombination frequency, which is simply the percentage of offspring that show recombinant phenotypes. For this problem, the answer is (515 + 489) / 8368 = 12%. This means that the genes are 12 map units apart.

6. This is an example of epistasis - one gene is influencing the expression of a second gene at a second location. In this case, dogs that are homozygous recessive for the e gene will be yellow, regardless of what alleles are at the location that determines pigment color (B for black and b for chocolate). The phenotypes of the parents are BbEe. Doing the cross results in a 9 black to 3 chocolate to 4 yellow labs.

7.

...........7..........3...................15..................5..........
-----/-----------/----------/---------------------------/-------------/---
.....b..........d...........a...........................c.............e

8. This is a simple incomplete dominance cross. The heterozygous individuals have green flowers. A cross of two green flowers gives results of 1 blue, 2 green and 1 yellow.

9. The genotype of the woman must be ii, since that is the only possibility for type O blood. Her baby, with type A blood, must have at least one i allele from the mother. Therefore, the babies genotype must be IAi. The IA allele must come from the father. The only man with an IA allele to contribute is man #2.

10. Pedigree A is an autosomal recessive trait. Pedigree B is a sex-linked trait because many more males exhibit the trait than females (7 vs 2). Pedigree C is a dominant autosomal trait. To differentiate recessive and dominant traits, there are a few things to look for. First is that recessive traits tend to skip generations. Look at generations I and III in pedigree A. For a dominant trait, at least one parent must exhibit the trait in order for it to be passed on to the offspring.

11. I treated this example like a regular dihybrid cross, but in this case the dominant allele will change based on the sex of the individual. The two parental genotypes are BbXX and BbXY. For female offspring, there will be 3 with hair for every 1 bald; and for males there will be 1 with hair for every 3 bald.

Tuesday, November 18, 2008

Genetics test

The test on genetics will be on Thursday, Nov 20. It will cover chapters 14 and 15. I have included two large PowerPoint presentations below. Both cover much more than we went over in class, and probably more than will be on the test.


And please remember to bring a #2 pencil for the test.

Saturday, November 15, 2008

History in (and of) Photos

As we enter into our discussion of DNA, I would like to take the time to point out the interesting story behind one of the more well-known photographs in science.


The photo shows up everywhere, it is used as the frontspiece to the chapter in our textbook, and is probably found in every biology textbook published since 1970 or so. As a biologist, I think it ranks with this picture in historical importance; maybe not in total brain power, but at least in terms of the public consciousness. More people have seen the picture of Watson and Crick than of the 1927 physics meeting.

So what is the history of this picture; why, how, and when did it become so famous and widely used?

The picture was taken by Anthony Barrington Brown on May 21, 1953, about a month after publication of Watson and Crick's results on April 25. There were a total of eight photographs taken that day, of which three are commonly reproduced: the famous one above, the slightly less staged version shown below, and one more of Watson and Crick drinking tea (or coffee) in their office. The other prints are not widely reproduced, and a Google Image search failed to uncover them.


Barrington Brown's own account of the day the photographs were taken is interesting. A friend of Barrington Brown's contacted him and asked him to take some pictures for a story that would be sent in to Time magazine. Barrington Brown describes his first meeting with Watson and Crick, and the circumstances behind the posed pictures:

I was affably greeted by a couple of chaps lounging at a desk by the window, drinking coffee. "What's all this about?" I asked. With an airy wave of the hand one of them, Crick I think, said "we've got this model"
[...]
Anyway, I had only come to get a picture so I set up my lights and camera and said "you'd better stand by it and look portentous" which they lamentably failed to do, treating my efforts as a bit of a joke. I took four frames of them with the model and then three or four back with their coffee.


The picture was not used by Time, nor did it appear in a story in the campus newspaper Variety. Barrington Brown was paid 52 pence for the photos, and they were forgotten by all, including the photographer. Up to the awarding of the Nobel Prize in 1962, there appears to be no record of the photos being widely published or distributed.

In 1968, James Watson's autobiographical tale of the discovery of the DNA sttructure, The Double Helix was published. The popularity of the book greatly increased demand for pictures of the pair, and the Barrington Brown photo, which appears in the book, best seemed to capture the personalities of the researchers. Barrington Brown has never received royalty payments for the use of his photos, though he is actively pursuing them now.

In the past 40 years, the photographs have achieved near iconic status, not just of Watson and Crick's discovery, but of scientific research in general. A testament to the iconic stature of the photograph is the fact that Watson and Crick got together nearly 40 years later in an updated version of the photograph.

Sunday, November 2, 2008